What kind of information was collected?
The scoping aimed at capturing the full picture of each demonstration site:
- Nature: species, habitats, and ecological data.
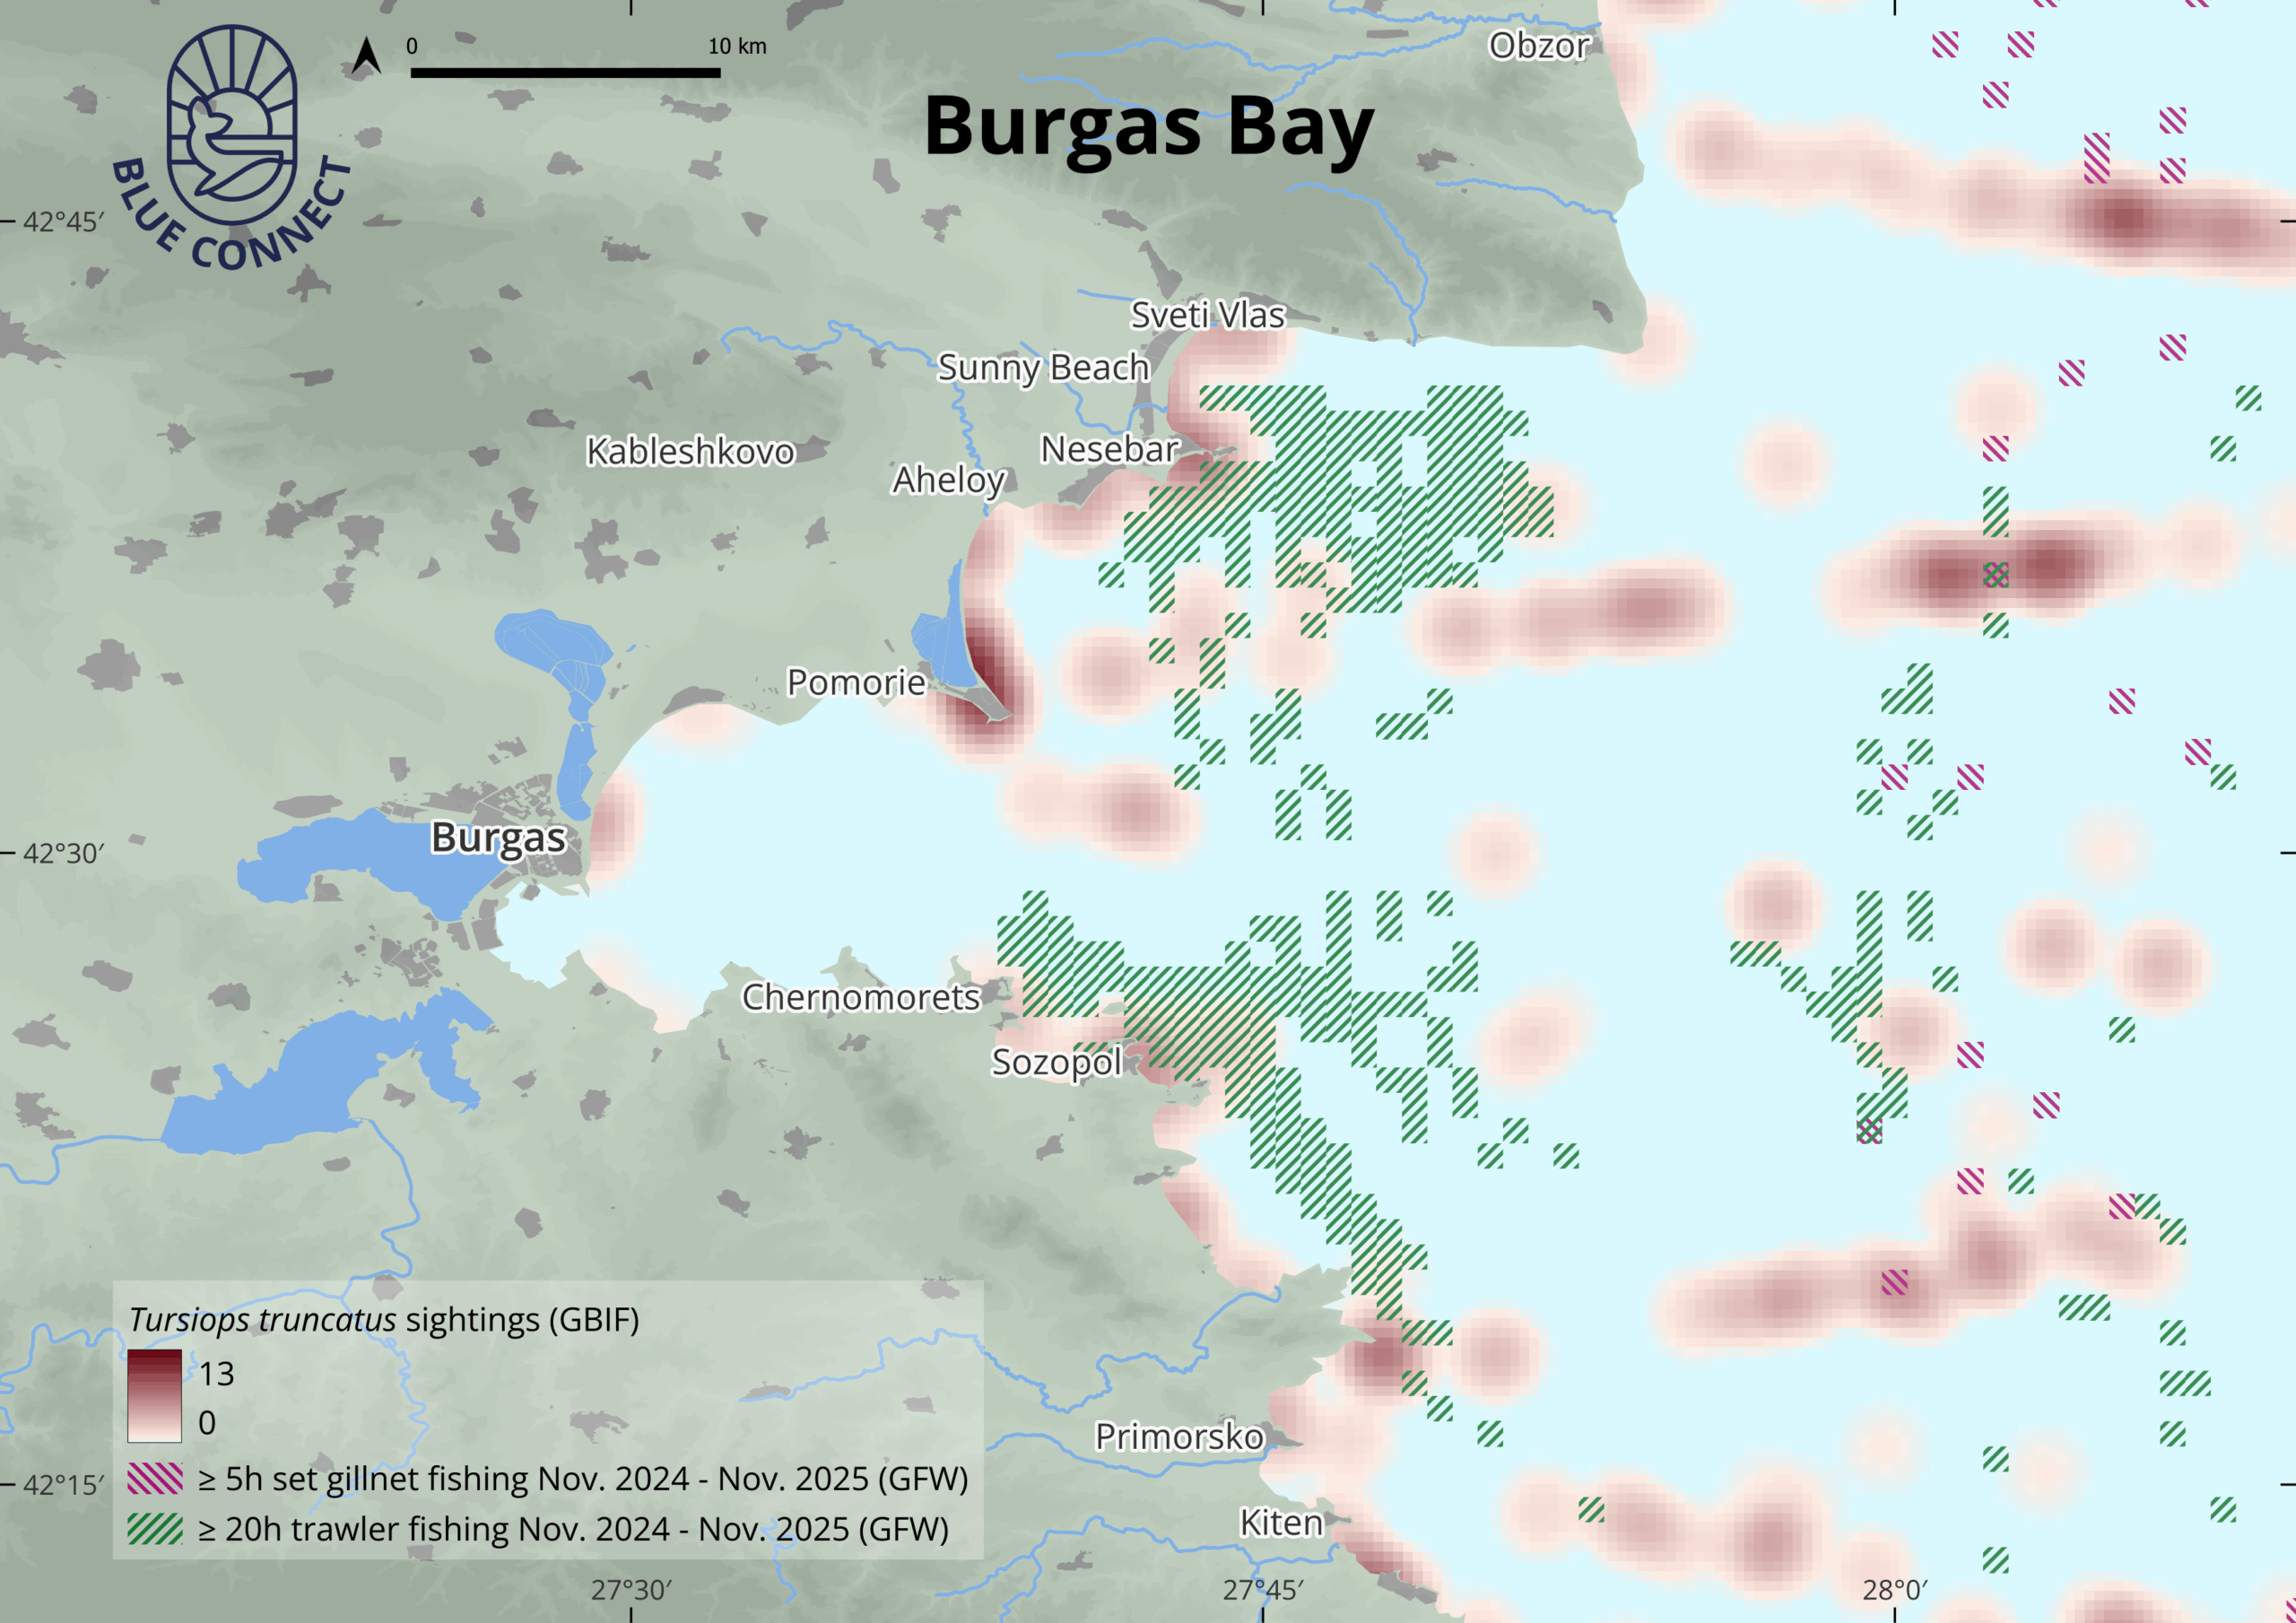
- Pressures: human activities such as fisheries, tourism, transport, and other uses.
- Protection & management: legal status, conservation measures, and the presence of a management body.
- Participation: involvement of local communities and stakeholders in decision-making.
- Monitoring & restoration: technologies, ongoing initiatives, and financial or institutional mechanisms.
- Strict protection measures, funding tools, …
By identifying both enablers and barriers, the assessment provided a comprehensive overview of each site’s challenges and opportunities.
How was the data collected?
The baseline assessment combined multiple perspectives to ensure accuracy:
- Expert input – Demonstration site leads completed detailed forms.
- Stakeholder interviews – Local working groups validated the expert knowledge and highlighted community concerns.
- Public surveys – Broader surveys captured perceptions and needs of the wider community.
All information was compiled into Deliverable 4.1, offering the first in-depth portrait of the 12 demonstration sites.
Key findings
The scoping and baseline analysis revealed several important insights:
- Complex use of space: Eight sites face important overlapping human activities. Fisheries dominate, but tourism, leisure, and transport are also significant.
- Innovation in monitoring: Five sites are piloting cutting-edge technologies, from environmental DNA (eDNA) to autonomous underwater vehicles (AUVs).
- Shared challenges: Limited financial and human resources, together with pressures beyond site boundaries, hinder effective conservation, monitoring, and enforcement.
- Limited awareness: Local communities in most sites have limited understanding of conservation goals and uncertainty about participation opportunities.
- Data contributions: Demonstration sites provided over 400 datasets, platforms, and catalogues to the data inventory, and more than 100 tools to the tool inventory.
These findings provide a snapshot of the key insights, for more details and the full analysis, you can consult the full deliverable 4.1.
Photo by Andrea Piacquadio


